
Dark mode for data-heavy products: contrast, readability and hierarchy
How to design dark mode for dashboards and data-heavy products: surfaces, contrast, color for gains and losses, type for numbers and a clear hierarchy.
By Alexander Cillán · · 6 min read
On this page· 9
Most of the products I design for traders, analysts and crypto teams ship in dark mode. Not because it looks cool, although it does, but because people use them for hours, often next to charts and other dark tools, and the numbers need to stand out.
When I designed the dashboard for ArbX, a sports betting analytics SaaS, the brief was easy to say and hard to do: make complex data digestible at a glance. Dark mode reduces eye strain over long sessions, and careful contrast makes wins, losses and earnings stand out, because in that product every second counts. These are the principles I’ve used on ArbX, Lunar, Astra and other data-heavy interfaces.
When dark mode is the right call
Dark mode isn’t automatically better. It suits some products far more than others.
It works well when:
- People keep the product open for long sessions, like trading, monitoring or analytics.
- The screen is full of charts and status colors that need to pop.
- Users often work in low light, or alongside other dark tools.
- The audience expects it, as in crypto, trading and developer tools.
It works less well for long-form reading, document editing and anything people print. If your users vary, offer both themes and respect the system setting.
Build surfaces, not just a black background
Pure white text on pure black can feel harsh, and some readers see a glow around the letters. I usually start from a very dark gray or a tinted dark color instead. Astra uses a deep navy; Lunar uses a near-black base with cards set apart by subtle borders.
On a dark interface, shadows barely show, so depth comes from lightness. I define a short scale of surfaces:
- Background: the darkest layer.
- Cards and panels: one step lighter.
- Raised elements: menus, popovers and hover states, another step lighter.
- Borders and dividers: low contrast, there to separate, not to decorate.
The closer something is to the user, the lighter it gets. Keep the steps small and consistent, and the layout will feel organized without a single drop shadow.
Contrast: comfortable, not maximum
- Meet WCAG AA: a contrast ratio of at least 4.5:1 for body text, and 3:1 for large text and interface components like icons and input borders.
- Use levels of emphasis. Off-white for primary text, a dimmer gray for labels and secondary text, and a lower one for disabled states. Material Design’s dark theme guidance uses roughly 87%, 60% and 38% opacity white for these three levels.
- Desaturate your colors. Bright, saturated colors vibrate on dark backgrounds. Slightly softer tones of your brand colors look sharper and are easier on the eyes.
- Check colored text too. Red and green numbers have to pass contrast checks, not just white text.
Color for meaning, not decoration
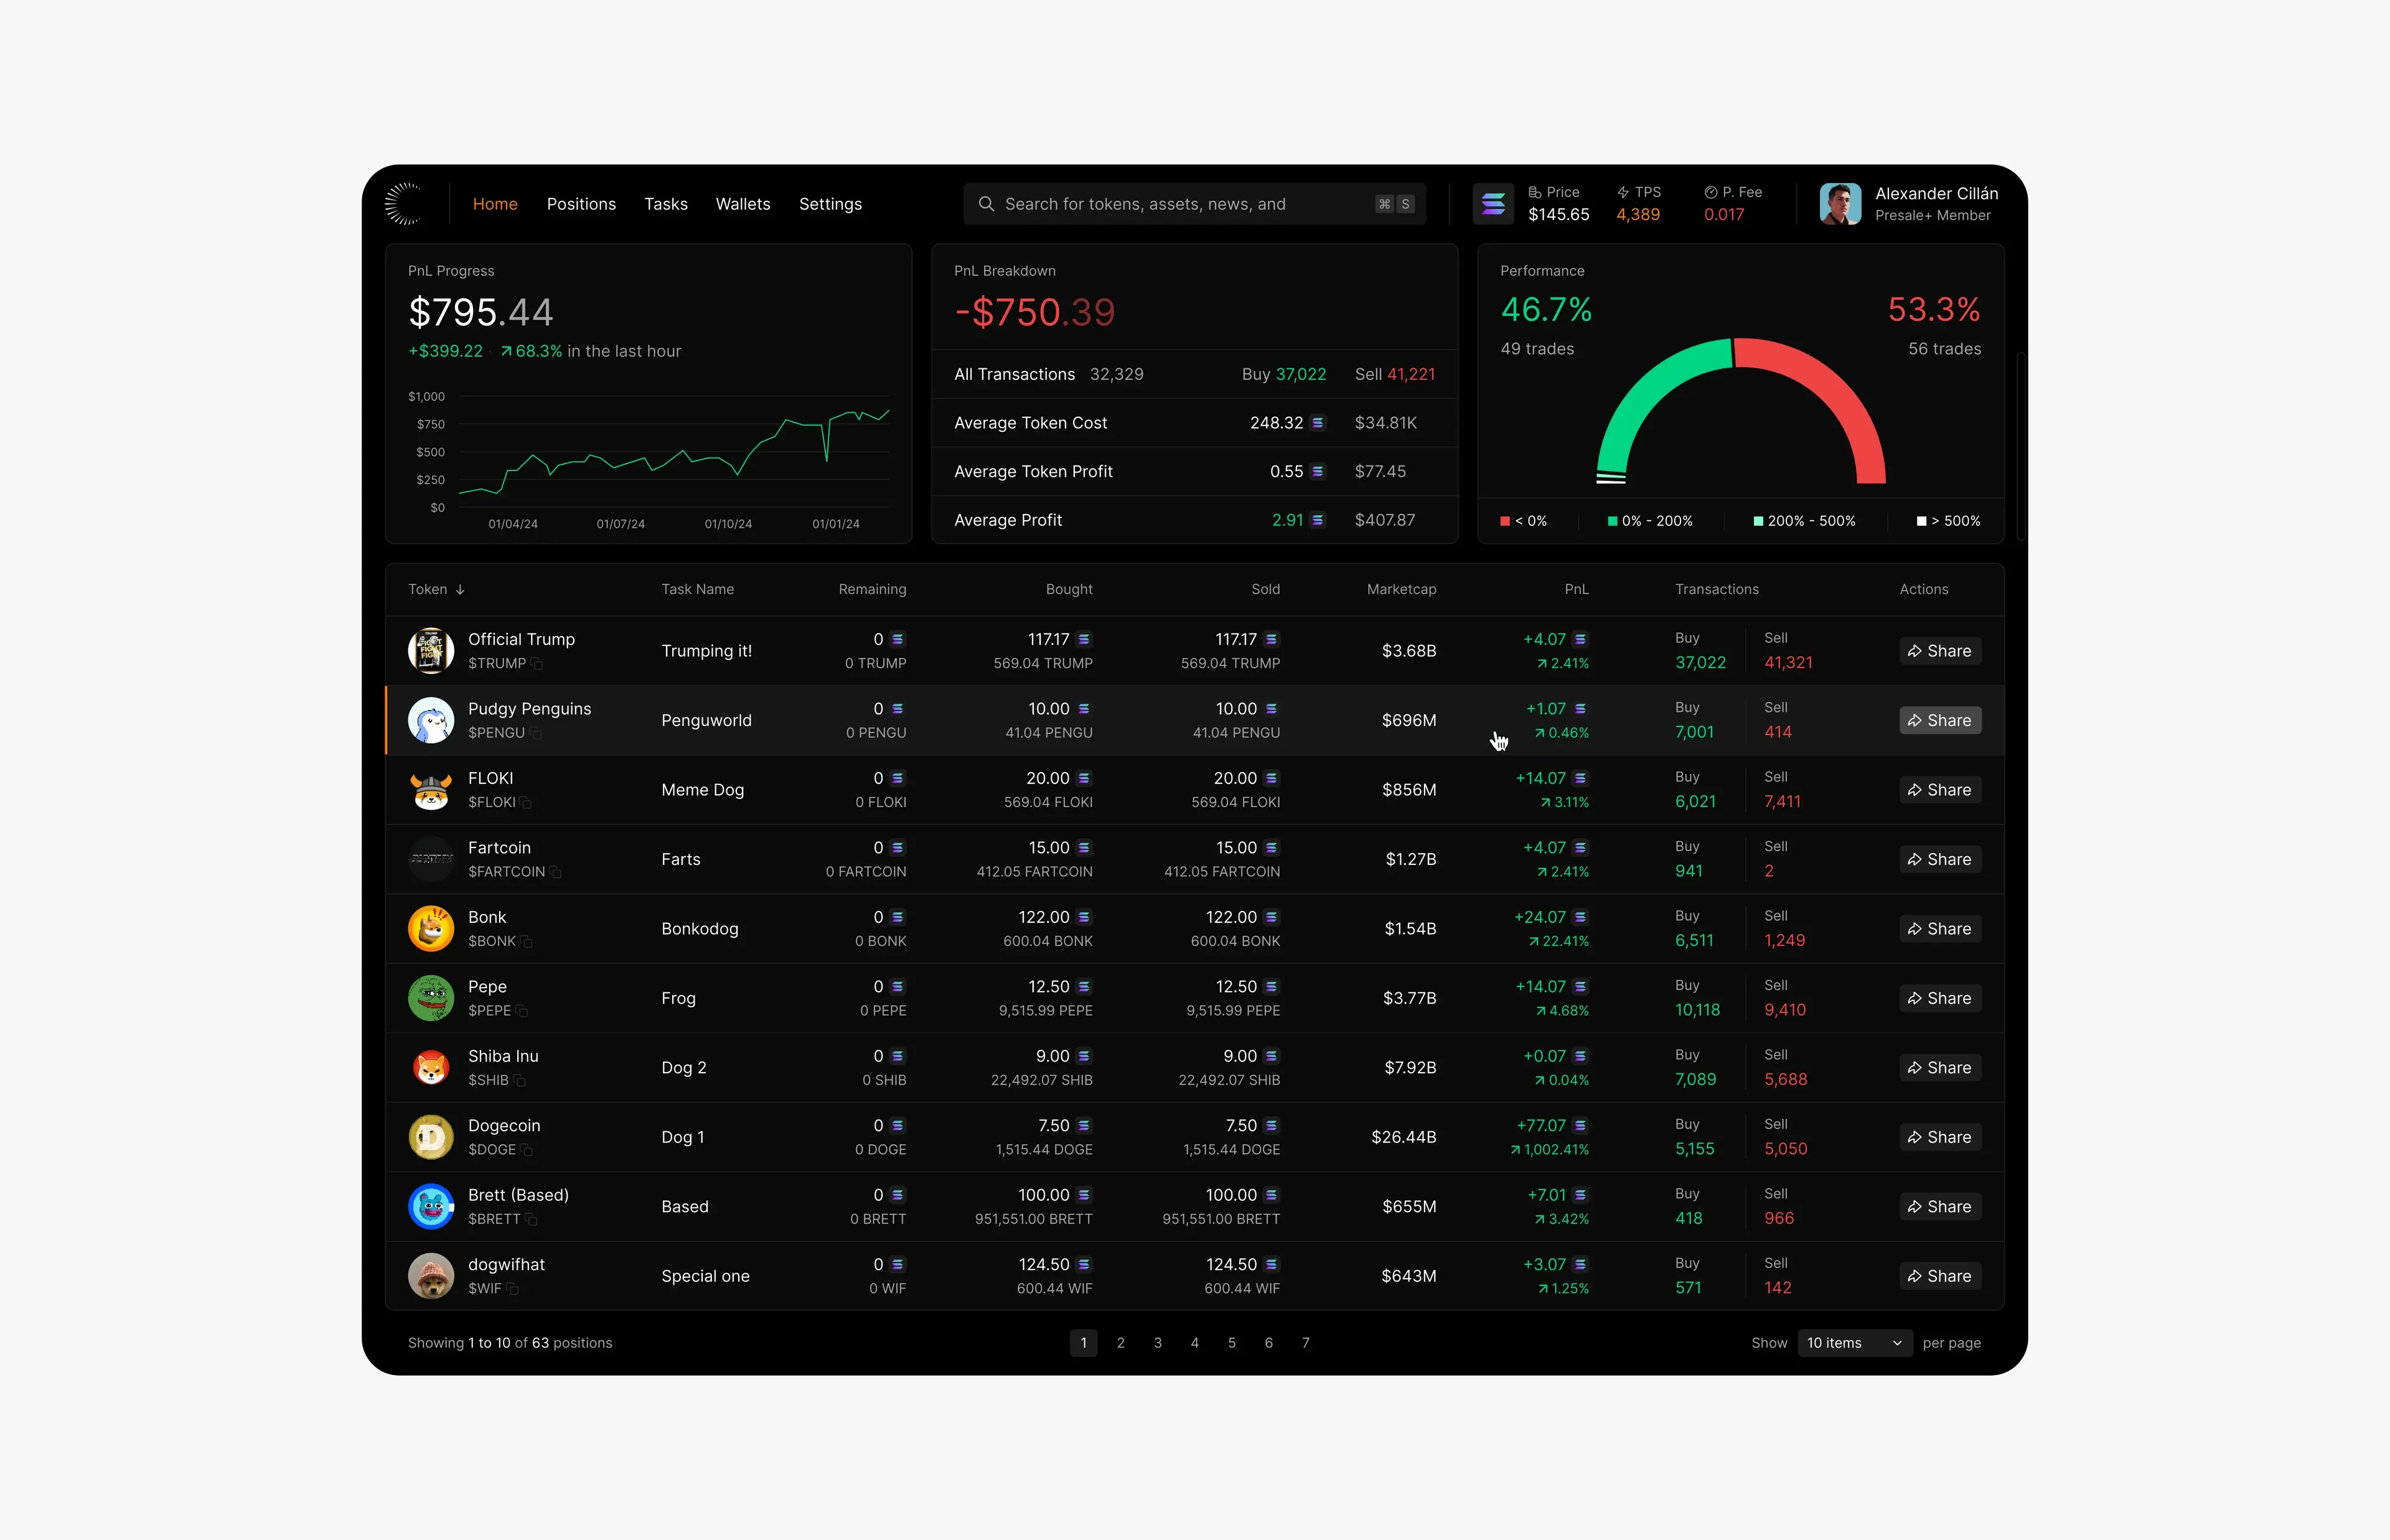
In a data product, color is information. On ArbX, contrast is what makes wins, losses and earnings readable in a fraction of a second. On Lunar, green and red carry profit and loss through every card, the performance gauge and the positions table, while a single orange accent marks the active page.
- Reserve green and red for up and down. If they also appear in illustrations or buttons, they stop meaning anything.
- Never rely on color alone. Roughly one in twelve men has some form of color blindness, so pair color with plus and minus signs, arrows or labels. Lunar shows a sign and an arrow next to every change.
- Use one accent for interaction. One color for links, selected states and primary buttons makes it obvious what’s clickable.
Type that makes numbers easy to read
- Use tabular figures, so digits have equal widths and columns line up.
- Right-align numbers in tables and left-align text. It makes comparing values much faster.
- Make the key number big and its label small. On Astra’s portfolio screen, the total value is the largest thing on the page, with the 24-hour change in color right below it.
- Go a little lighter on weight. Light text on a dark background looks heavier than dark text on light, so I often use a regular weight where light mode would use medium.
- Give rows room. Generous row height and a subtle hover state help people track a line across a wide table.
Hierarchy: one glance, then the detail
A good dashboard answers the main question in one glance and lets people dig deeper when they want to. ArbX relies on clear graphics and logical grouping for speed. Its simulator follows the same idea: you select the competition, the bet type and the player, then get simulation results in seconds, with each step in its own lane so nothing feels overwhelming.
The structure I use most often:
- Summary cards at the top: three or four key numbers, like Lunar’s PnL progress, PnL breakdown and performance.
- The main chart or table below, with sensible defaults for sorting and time range.
- Filters and settings in a panel, out of the way until needed.
- Details on demand: hover states, expandable rows and drill-down pages.
Dark mode beyond dashboards
The same principles apply to websites. For Timepiece FNF, a dark, luxurious website lets the watches shine, the way dark backgrounds make metal and glass glow. I go into that side in luxury website design principles.
Before you ship
- Test on OLED and LCD screens, at low and high brightness.
- Keep chart gridlines faint enough that the data stays in front.
- Check logos, avatars and images with transparent backgrounds.
- Make focus states clearly visible for keyboard users.
- If you offer both themes, follow the system setting by default.
For the rest of the product, my SaaS redesign checklist covers the audit, states and design system.
Frequently asked questions
Is dark mode better for dashboards?
Often, but not always. It suits products people use for long sessions, with many charts and status colors, especially in trading, analytics and developer tools. For reading-heavy or printed content, a light theme is usually better.
What background color should I use for dark mode?
A very dark gray or a tinted dark color, like navy, rather than pure black. It reduces glare, keeps text comfortable to read and leaves room for lighter surfaces to show depth.
How do I check contrast in a dark UI?
Use a contrast checker and aim for WCAG AA: at least 4.5:1 for body text and 3:1 for large text and UI components. Check every text color, including red, green and gray labels, against the surface it actually sits on.
Should a product offer both light and dark mode?
If your users work in different conditions, yes. Design both themes from the same set of color tokens, follow the system setting by default and let people switch manually.
Keep reading
Article · August 6, 2026 · 3 min read
Lessons from founding Affinity Dashboards: how I think about dashboard design
Principles for designing dashboards people actually use, and what founding a company changes in how a designer thinks about scope, cost and decisions.
Article · July 20, 2026 · 3 min read
Redesigning a SaaS product: a 12-point UI/UX checklist
A practical UI/UX checklist for redesigning a SaaS or AI product, from the audit and navigation to states and design systems, based on redesigning 100+ screens.