
ArbX: designing a sports analytics dashboard you can read at a glance
How I designed ArbX, a sports betting analytics SaaS: a dark dashboard you can read at a glance, a step-by-step simulator and an animated pricing grid.
By Alexander Cillán · · 5 min read
- Client
- ArbX, sports betting analytics SaaS
- Industry
- Sports analytics, SaaS
- Services
- Dashboard UI design, simulator UX, pricing section design
On this page· 6
ArbX is a SaaS product for sports betting analytics. People open it for numbers: how their record looks, where they won and lost, and what a scenario might look like before they act on it. The data is dense, it changes quickly, and the people reading it want answers fast.
I designed three key parts of the product: the main dashboard, a simulator that works through a scenario step by step, and the pricing section where visitors decide which plan fits them. This case study is about interface design, not about betting itself. The same principles apply to any analytics tool where people make decisions under time pressure.
The challenge: a lot of data, very little time
Analytics products share a common problem. The team behind them knows how valuable every metric is, so every metric ends up on the screen with equal weight. The result is a wall of numbers that’s technically complete and practically unreadable.
For ArbX, speed mattered more than usual. In this space every second counts, and a user who has to hunt for a figure has already lost the moment. So the goals were simple to say and hard to do:
- Make complex data digestible at a glance.
- Make the outcomes that matter most, wins, losses and earnings, impossible to miss.
- Let people run a simulation without feeling overwhelmed.
- Present the plans so clearly that nobody has to guess what they’re paying for.
A dark dashboard built for long sessions
A dashboard like this stays open for long stretches, so I designed it in dark mode to reduce eye strain. Here, dark mode isn’t just an aesthetic choice. On a dark background, a small set of accent colors carries more meaning, and the data has room to stand out.
Contrast that does the reading for you
Contrast and readability are the main tools for hierarchy. Wins, losses and earnings each get a clear visual treatment, so the eye lands on the outcome before the detail. You should be able to glance at the dashboard and know how things are going before reading a single label.
Clear graphics over raw numbers
Where a number tells a story over time, it becomes a chart. Where it’s a single headline figure, it gets its own space and a large, legible size. Detailed rows are kept for the information people genuinely want to scan line by line.
Logical grouping for speed
Related metrics sit together, so each area of the screen answers one question. Grouping is what makes a dense screen feel calm: when you know where each type of information lives, you stop searching and start reading.
The simulator: one decision per lane
The simulator lets users model a scenario before they act on it. The flow has three inputs: select the competition, select the bet type, select the player. Then the simulation results come back in seconds.
The risk with any tool like this is putting every option on one screen. Several dropdowns, filters and a results panel all compete for attention, and new users freeze. So each step lives in its own lane, in the order you need it: competition, then bet type, then player. Each lane asks one question, which keeps the flow light even though the logic behind it isn’t.
Splitting the flow also makes the output easier to trust. Because the inputs are clear and made one at a time, users know exactly which scenario they’re looking at when the results appear. It’s the same principle behind the step-by-step selling flow in the Timepiece FNF project: one decision per step reduces mistakes and makes a complex task feel short.
A pricing section with an animated grid
Pricing is where a visitor decides whether the product is worth it, so the section has two jobs: look like part of a serious product, and make the offer easy to understand.
For the look, I designed a continuous grid that runs behind the pricing section, with subtle animation and opacity shifts. It gives the page a futuristic feel and ties it to the sleek dark theme of the product itself, so moving from the website into the app doesn’t feel like switching brands.
For clarity, the motion stays in the background. The plan details stay still, high-contrast and easy to compare, so it’s easy to see exactly what you get. Animation should add atmosphere. It should never compete with the information people came to read.
What I’d apply to any analytics product
- Decide what matters first. Pick the few numbers that answer “how am I doing?” and give them the strongest contrast on the screen.
- Use dark mode for a reason. It reduces eye strain in long sessions and makes accent colors meaningful. On its own, it’s just a style.
- Group by question, not by data type. Each area of a dashboard should answer one question.
- Break complex inputs into steps. One decision per lane beats one screen with every option.
- Keep motion in the background. Animated details can set the tone, but data and prices should stay still and readable.
I cover more of this in my 12-point SaaS redesign checklist, and you can see a larger product redesign in the ChromaAI case study.
Frequently asked questions
What makes a good analytics dashboard design?
A clear hierarchy. The few numbers that matter most get the strongest contrast, related metrics are grouped together, and charts replace raw figures wherever a trend matters more than the exact value. If users have to search for the key number, the dashboard isn’t doing its job.
Is dark mode better for data dashboards?
For tools people keep open for long sessions, dark mode can reduce eye strain and help accent colors stand out. It only works with careful contrast, though: low-contrast gray text on a dark background is harder to read, not easier.
How do you design a complex multi-step tool without overwhelming users?
Give each decision its own step or lane, in the order people need it. In the ArbX simulator, users select the competition, the bet type and the player one at a time, then get the simulation results in seconds.
Should a SaaS pricing section use animation?
Subtle animation can make a pricing section feel like part of the product, as the grid behind ArbX’s plans does. Keep it in the background and keep the plans themselves still, high-contrast and easy to compare.
Keep reading
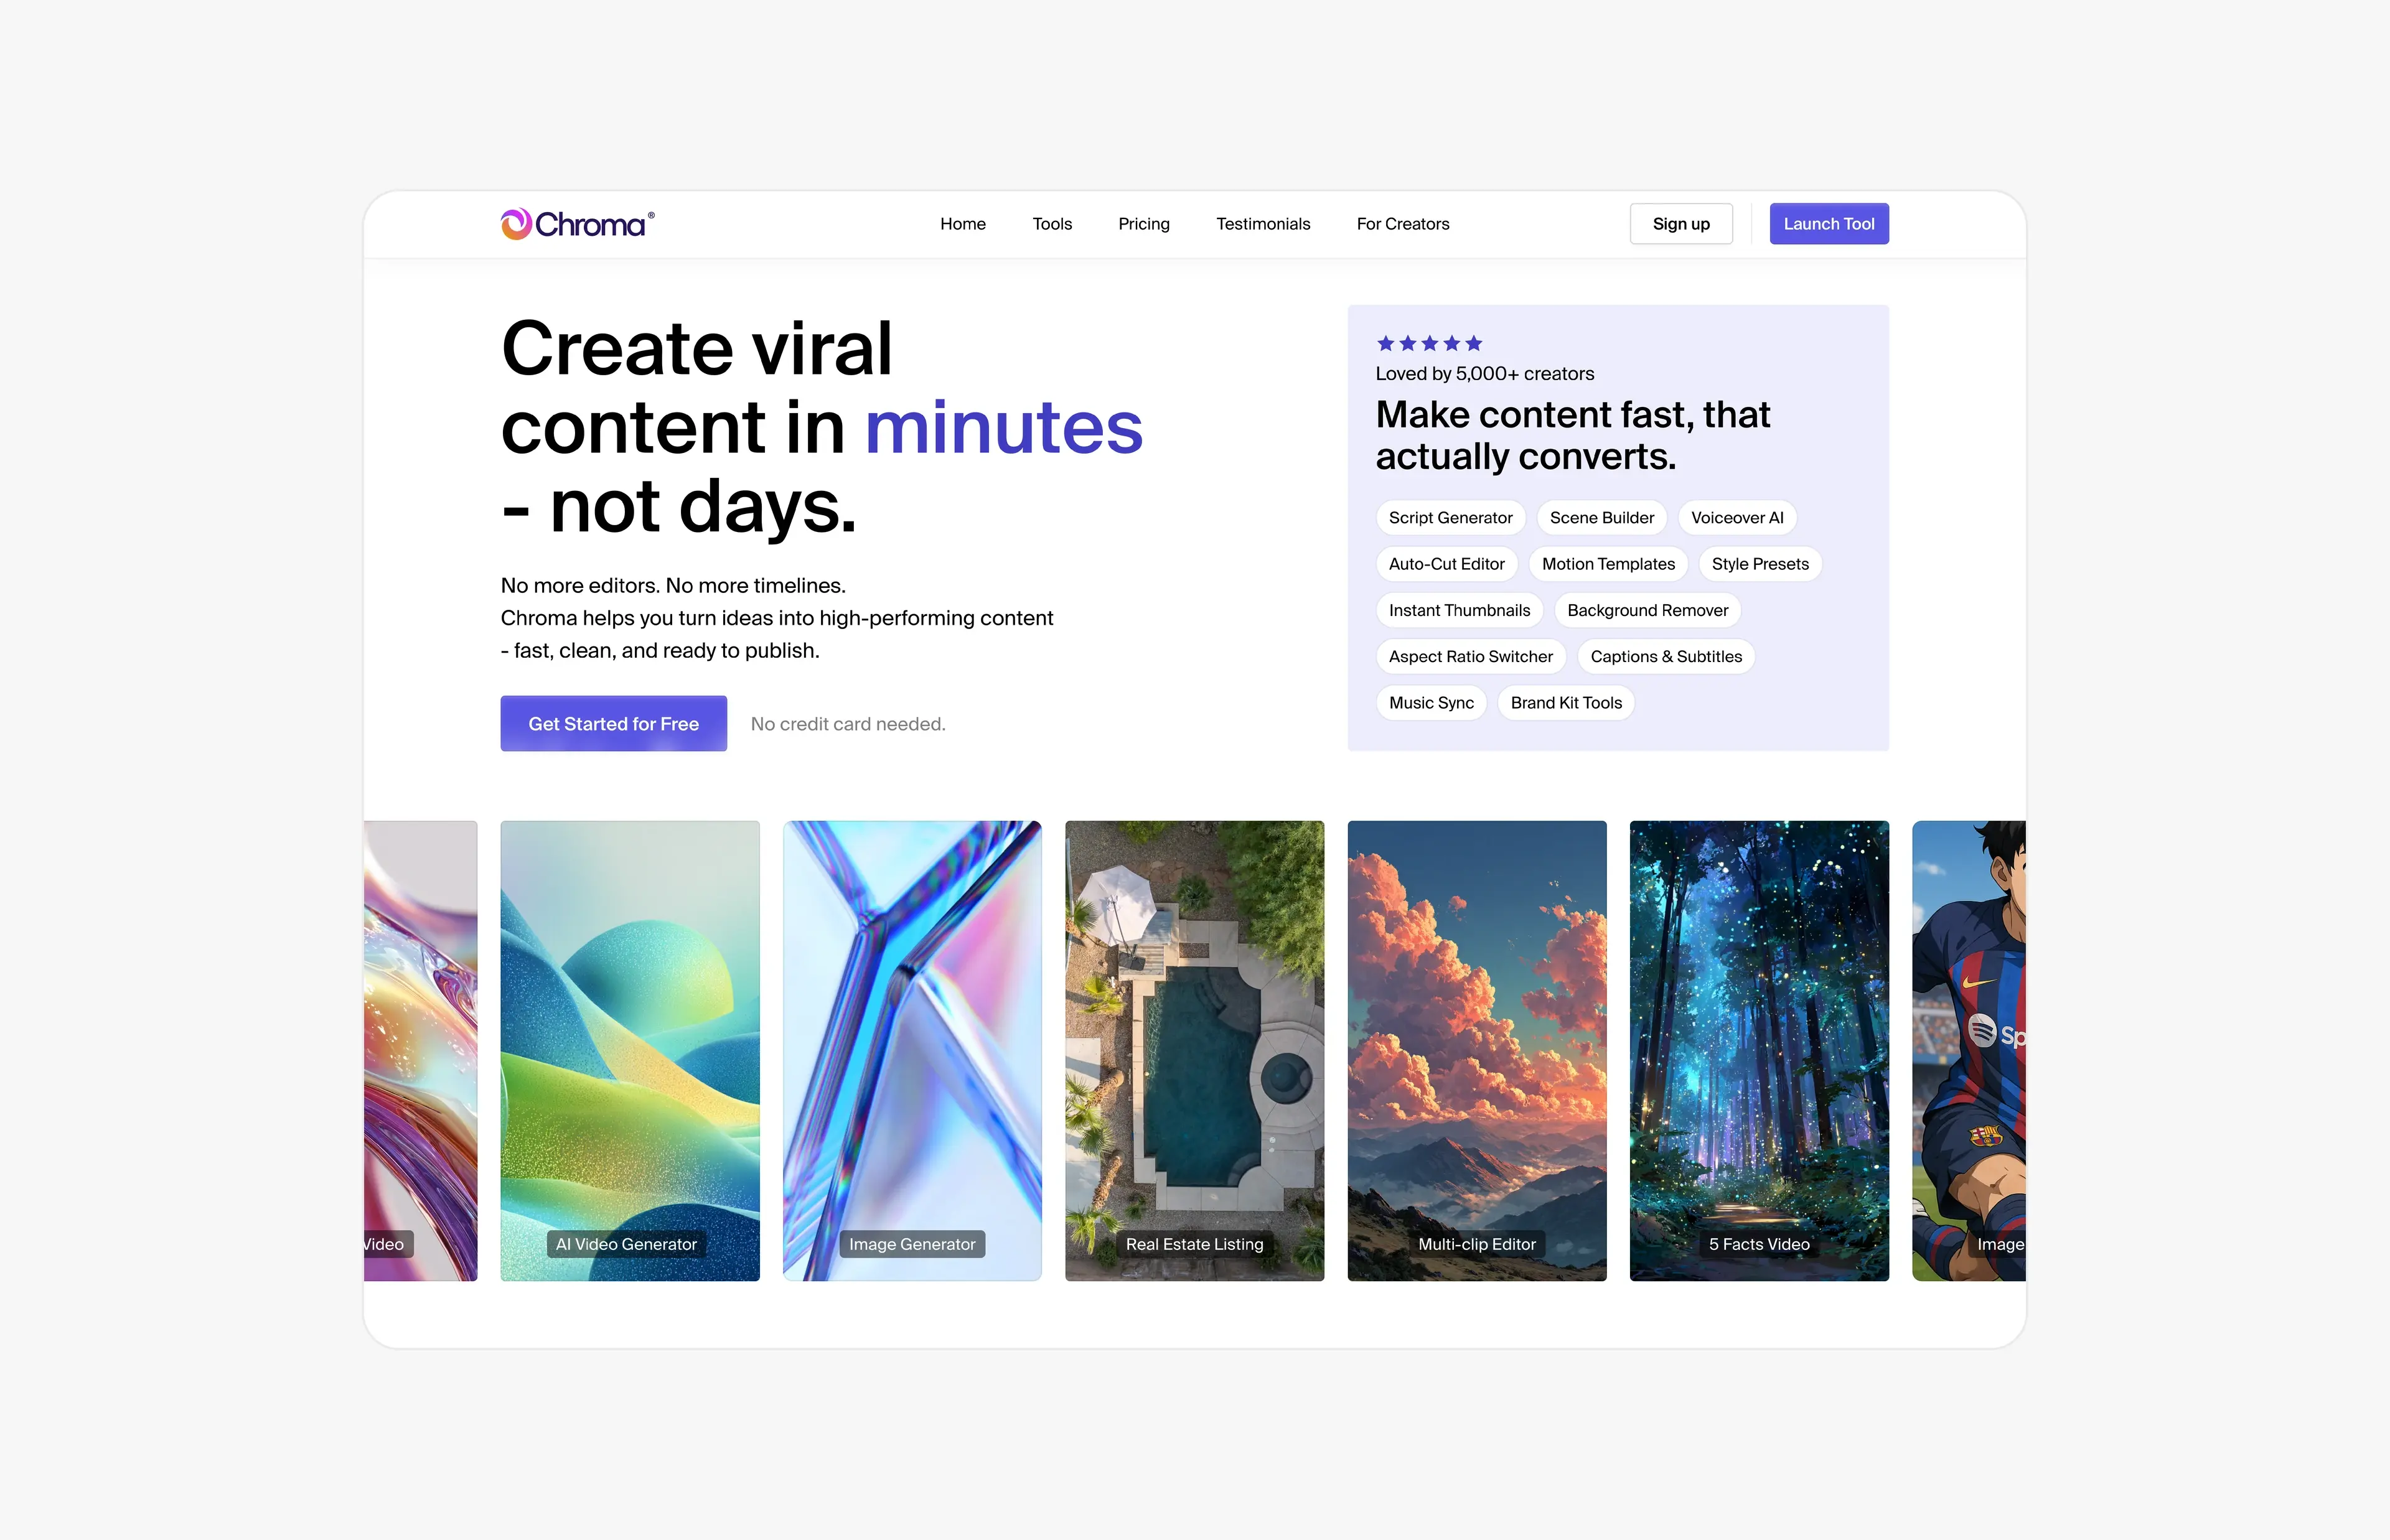
Case study · June 21, 2026 · 5 min read
ChromaAI: redesigning an AI content platform across 100+ screens
How I turned ChromaAI’s MVP into one cohesive creator platform: 100+ redesigned screens, a design system for 10+ AI tools and a 30-second launch video.
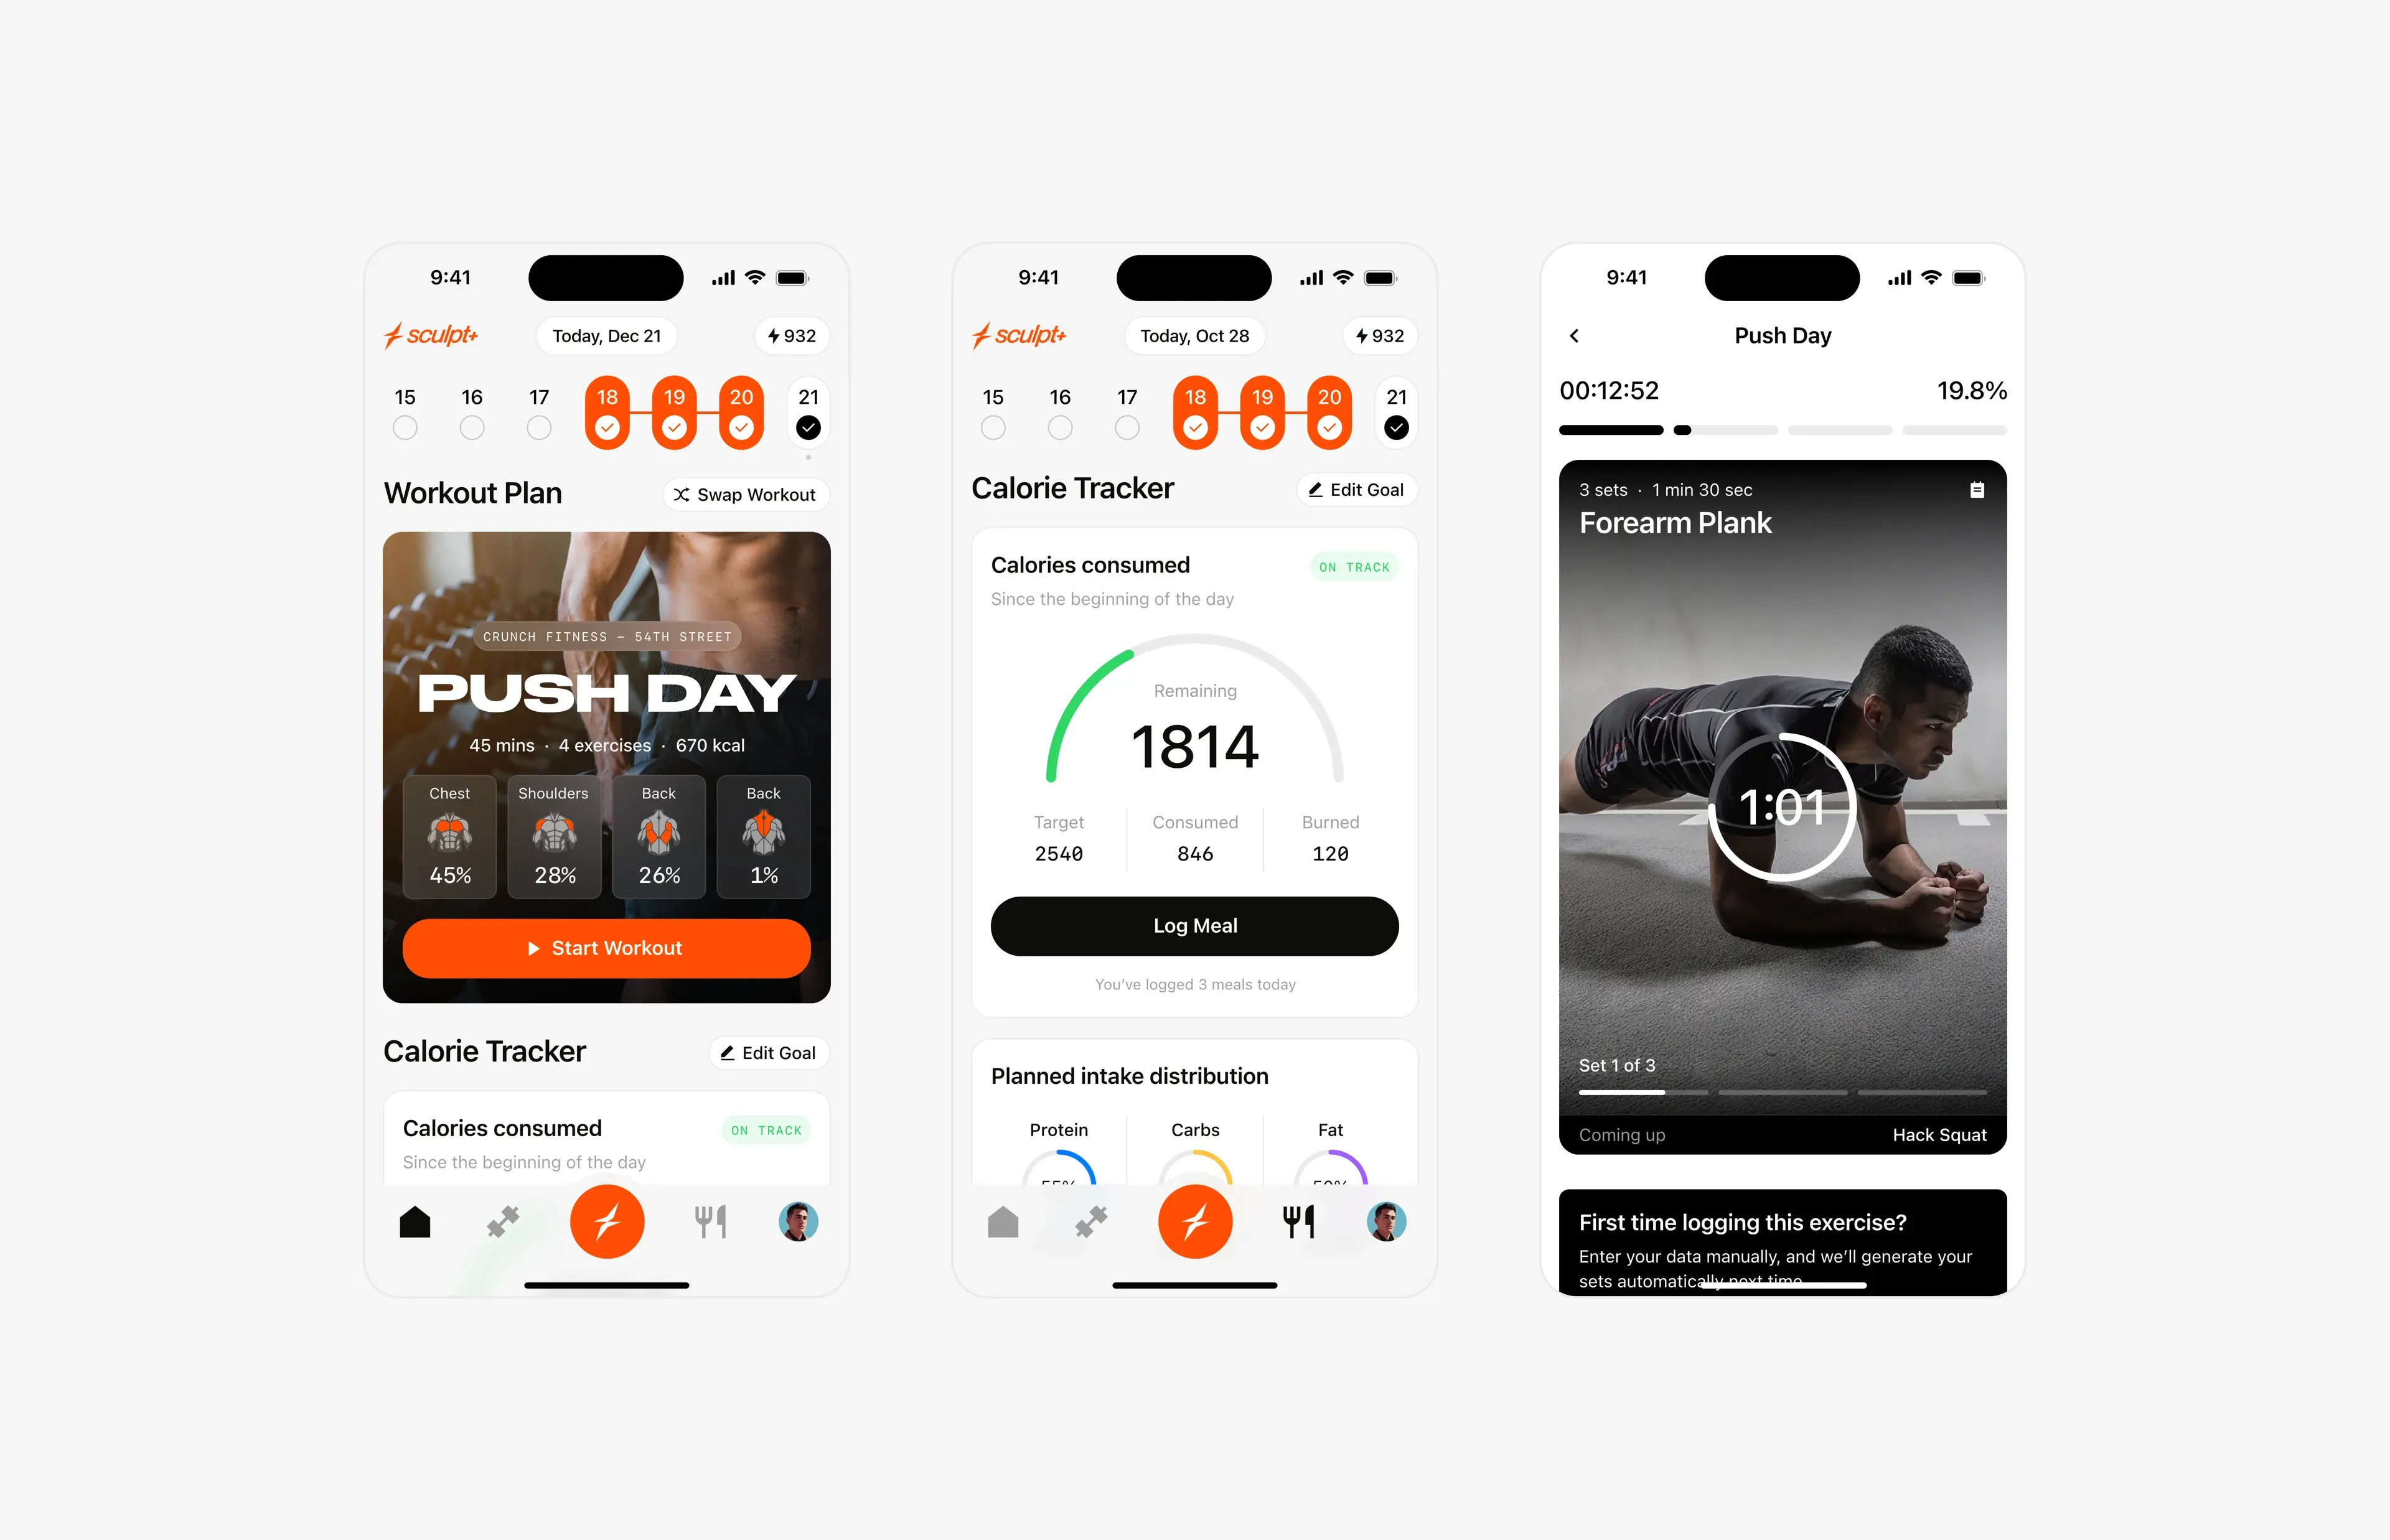
Case study · September 2, 2026 · 6 min read
Sculpt AI: brand, motion and 150+ screens for an AI fitness app
How I led the creative for Sculpt AI: a new brand identity, splash motion, a new user flow and 150+ screens for an AI app that unites workouts and food logging.